Weekly Market Commentary - May 24th, 2025 - Click Here for Past Commentaries
-
Equities, bonds and the dollar all retreated last week amid renewed focus on the U.S.
budget deficit and rising debt. Fresh tariff threats were also a reminder that trade
developments remain in the driver's seat.
The Moody's downgrade of U.S. government credit shines a spotlight on the growing
debt burden. Yet, the decision does not impact the fundamental drivers of the economy
and markets.
The House passed a new tax bill that extends existing tax cuts and includes new ones.
The bill now moves to the Senate for debate and possible revisions. We expect a modestly
stimulative fiscal policy supporting growth but also feeding into deficit concerns.
The House passed a new tax bill that extends existing tax cuts and includes new ones.
The bill now moves to the Senate for debate and possible revisions. We expect a modestly
stimulative fiscal policy supporting growth but also feeding into deficit concerns.
-
After a near 20% rally in the S&P 500 since the April 8 low, rising bond yields together
with fresh tariff threats are now tapping the brakes on investor optimism. While trade
developments have been widely covered, our focus here is on three additional catalysts
behind the market's shift in tone: a credit-rating downgrade by Moody’s, a weak 20-year
Treasury auction, and news that the House passed a reconciliation bill—named the
“One Big Beautiful Bill”—which extends expiring tax cuts and proposes new ones. While
passage in the House is a milestone, the bill now moves to the Senate for debate and
possible revisions.
Meanwhile, the 30-year Treasury yield climbed above 5%, the dollar weakened against major currencies, and equities pulled back amid renewed focus on the U.S. budget deficit and rising debt levels1. Though the trigger was new, the underlying concern about fiscal sustainability is not. The question now appears to be whether these developments mark a turning point for markets, or simply a temporary pause, and what signals the bond market is sending.
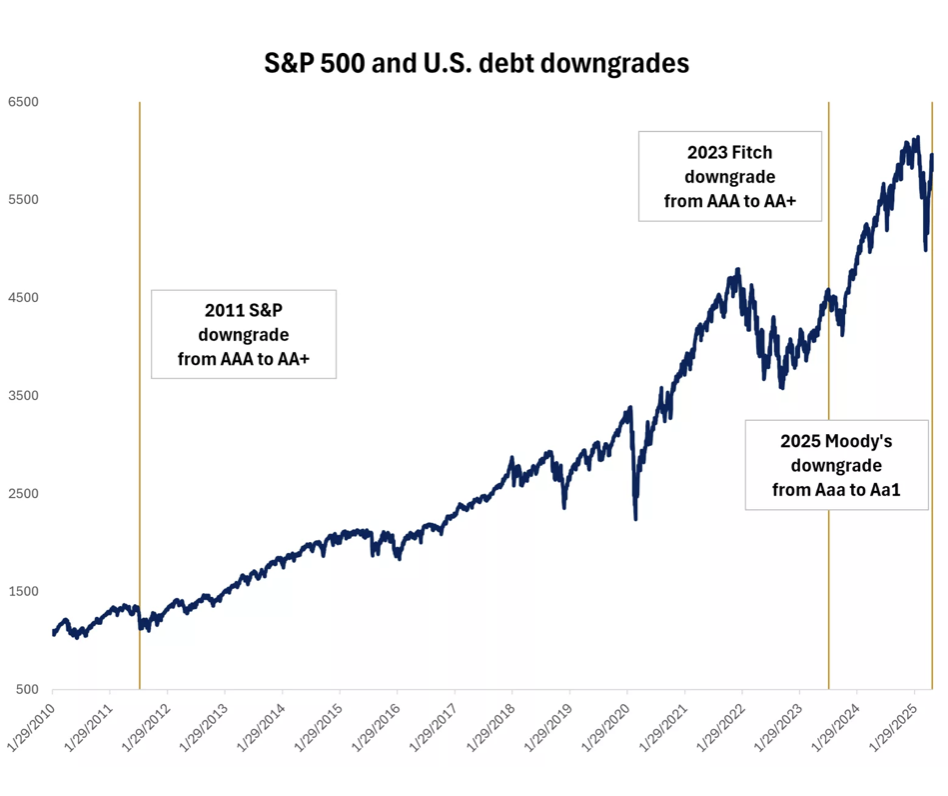
Moody's became the last of the "Big Three" rating agencies to downgrade U.S. debt, citing a lack of progress from numerous past Congresses and administrations to address rising fiscal deficits, and growing interest costs as a percentage of GDP. The one-notch downgrade means that the U.S. lost its last triple-A credit rating after Standard & Poor's (S&P) took similar action in 2011 and Fitch in 2023.
Nearly 15 years ago when the S&P made the same decision, the market reaction was swift, with volatility spiking and equities pulling back. However, last week's action was hardly a surprise, in our view, as Moody's had the U.S. on negative watch since November 2023 and its downgrade simply matched the rating of the other two agencies. Major index providers had already moved U.S. government bonds to the double-A bucket, as they either use the middle rating or the lowest (worst) of the three to determine index eligibility. This is why the latest downgrade won't trigger forced selling of Treasuries by passive funds that track these indexes.
The upshot is that the Moody's move doesn’t have any direct market implications in our view, but it does shine the spotlight on the worsening fiscal outlook at a time when Congress is in the process of passing a bill that is expected to push deficits higher for the remainder of the decade.
-
On May 22 the House passed the reconciliation bill by one vote, the narrowest of margins.
The bill primarily extends the 2017 current tax cuts and includes additional proposals that
were highlighted during the Trump campaign. These include tax breaks for tips, overtime, and
seniors, as well as raising the state and local tax (SALT) deduction cap to $40,000 vs. the
original $10,000 for those earnings under $500,000.
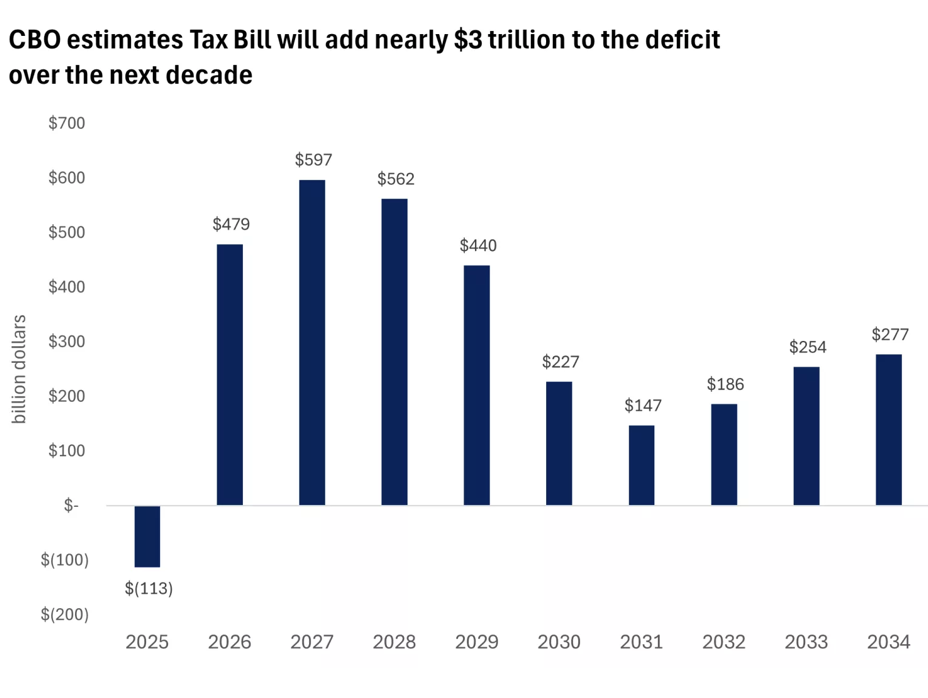
To help cover the cost of the tax proposals, the draft bill included several provisions to raise revenue, including reductions to renewable-energy incentives, tightened eligibility for health and food aid programs, and Medicaid work requirements, among others. When netting out the tax cuts, new spending, revenue provisions, and additional interest-rate cost, the Congressional Budget Office estimates that the bill would add nearly $3 trillion to the budget deficit over the next decade.
Many of the tax cuts are front-loaded, designed to be in force from 2025 to 2028, while and the spending cuts are backloaded, likely pushing the deficit to 7% of GDP in the next two years. The likely increasing deficit is mathematically a positive from an economic standpoint, adding to GDP, though its impact is likely to be partly offset by the drag from tariffs. We expect a modestly stimulative fiscal policy supporting growth but also feeding into deficit concerns. However, we would highlight that the final bill could look very different than the House version that was just passed. This is likely the start of a long process, with Congress setting a goal of a final bill signed into law on July 4.
-
The 10-year Treasury yield exceeded 4.5% last week and the 30-year crossed the 5% mark,
nearing the highest since 2007. These moves potentially send a warning signal that the
bond market is starting to pay attention to the government's debt trajectory and fiscal
discipline. Rising borrowing needs may affect long-term Treasuries more than short-term bonds,
steepening the yield curve, as investors require additional yield (a risk premium) to hold
long-term debt. In our view, the recent jump in yields partly reflects these emerging concerns,
as highlighted by the Moody's downgrade. However, we think there is more to the yield
story.
As the administration has softened its stance on trade (at least up until last Friday), the odds of a recession have fallen, and stocks have made a roundtrip, returning where they were at the start of the year. Similarly for the bond market, reduced headwinds to growth, together with upcoming fiscal stimulus, have led to a recalibration in Fed rate-cut expectations. Bond markets once again expect only two or fewer rate cuts this year, and the 10-year Treasury yield is back to where it started the year. Longer-term U.S. bond yields are higher, but that has been a global move. The 30-year yield on Japanese bonds last week hit the highest on record, and long-term bonds in Germany, the U.K. and Australia were also under pressures.
We prefer the seven to-10-year bond segment instead of the 10+, but we think that bond yields are currently attractive. For maturing CDs and portfolios with an oversized allocation to cash-like investments, we recommend considering intermediate- and long-term bonds to lock in the higher yields for longer. In our view, the rise in bond yields is self-limiting, as higher yields 1) attract more demand; 2) slow economic activity and inflation, leading the Fed to reconsider rate cuts; and 3) may prompt policy changes with lawmakers pulling back on some spending initiatives or adding offsets.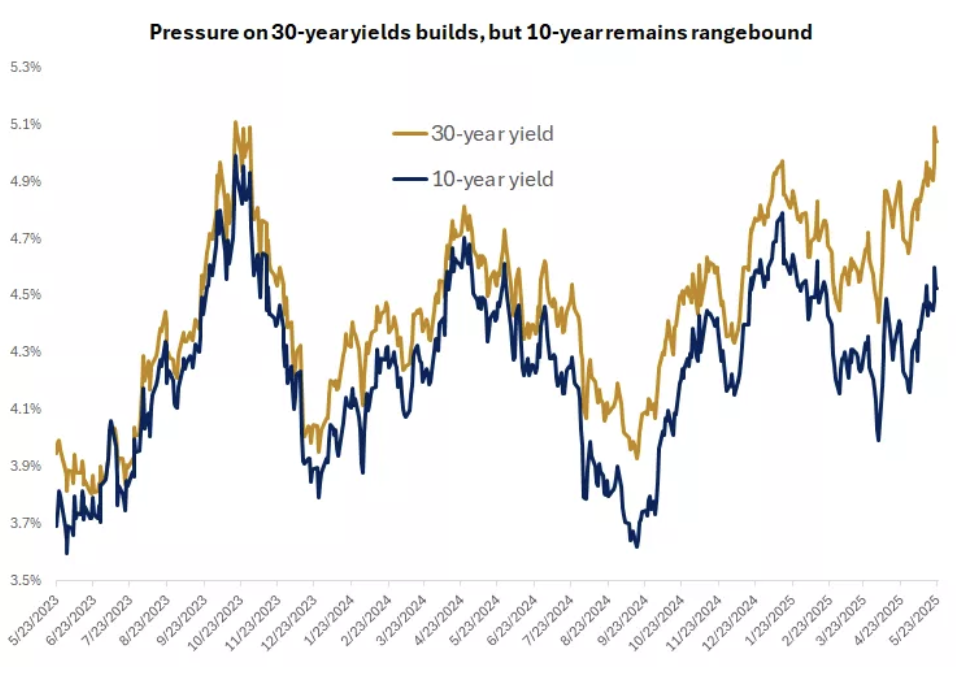
-
Trend is worrisome: 10 years ago, the federal deficit was $472 billion, or about 3% of GDP.
By 2019, after the 2017 tax cuts and before the pandemic, the deficit had jumped to $984 billion,
or 4.6% of GDP. And last year, the deficit was $2 trillion, or 6.7% of GDP. During this timeframe
the S&P 500 has returned 230%, including dividends.
However, the numbers are getting more challenging. Even before the new tax bill, the CBO was projecting that the debt-to-GDP ratio could reach a record high of 150% of GDP within the next 10 years. With interest rates still high, interest costs to service the existing debt are becoming a larger burden to the budget. At 3% currently, interest payments on federal debt as a percent of U.S. GDP are matching the highs of the late-1980s and early-1990s.
No doubt the fast-increasing deficits and federal debt at a time when the economy is expanding and unemployment is historically low are concerning. But unlike corporations and households, the U.S. government is borrowing in its own currency, which it issues, and it can also roll over the debt indefinitely. Though it cannot run out of money in the same way that a company or an individual would, printing too much money can lead to inflation. While fiscal concerns are not new and are not going away anytime soon, we don’t see the debt situation being a near-term threat to the economy, but we do believe it will require tough fiscal choices down the road. A combination of tax hikes and spending cuts or potential adjustments to entitlement programs, such as Social Security, are likely.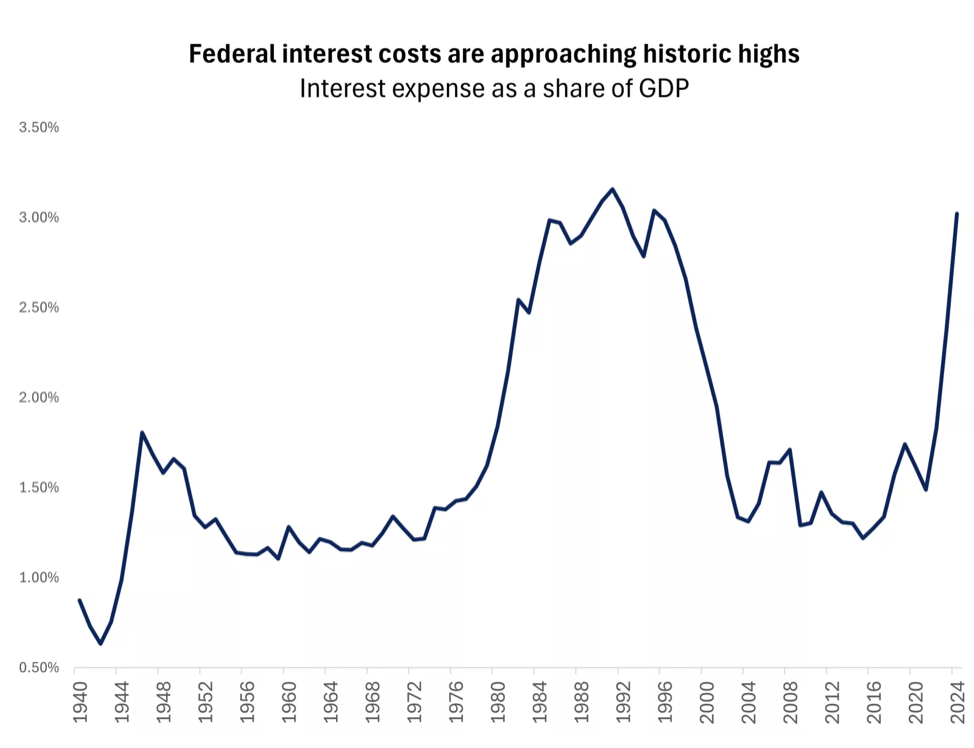
Despite the challenges, we think U.S. Treasuries remain the world's premier safe asset. That is not because of the U.S. debt's credit rating, but because of the Treasury market's enormous liquidity and market depth, allowing international investors to store money and invest in the government debt of the largest economy, whose currency is the world's reserve. For now, there is no other asset class to act as a realistic alternative, in our view. It's also worth noting that Japan, China and the United Kingdom all have government debt that is a higher percentage of GDP.
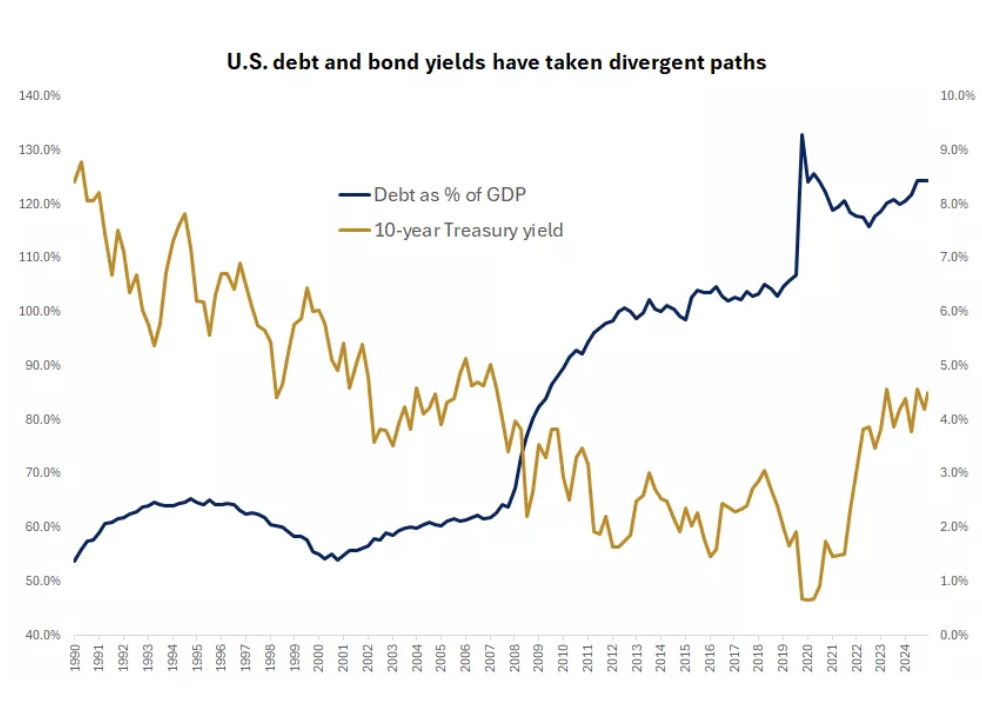
A review of the historical relationship between bond yields and debt levels for large-advanced economies reveals that a rising debt/GDP ratio has not coincided with higher bond yields, and in fact it's been the opposite. When the government was running a surplus between 1997 and 2001 under the Clinton administration, the 10-year yield hovered around 6%, while during in the post-pandemic years yields fell to record lows despite deficits exploding1. That is not downplaying the need for fiscal restraint, but it appears to highlight the importance of considering the economic growth and Fed policy regimes that are still the primary driver of yields.
Deficits and debt matter for investors, but more so from a financial planning perspective as taxes are currently historically low (investors may want to consider proactive tax strategies before potential increases), and less from a portfolio standpoint, in our view.
-
The threats of 50% tariffs on the European Union and a 25% levy on Apple late in the week acted as
a reminder that trade developments remain the No. 1 issue for the markets. With stocks enjoying a
strong run over the past two months, the negative reaction to the news was not surprising. On the
other hand, yields retreated, and bond prices rose.
We think that near-term market gains may be harder to achieve. Because many tariffs are paused rather than removed, we are not out of the woods yet. The 90-day pause on the initial tariffs is set to expire in July, while the lower tariffs on China expire in August. These deadlines also coincide with the U.S. debt-ceiling stand-off, which could add to market volatility. While we expect a resolution, it may not come until the last minute.
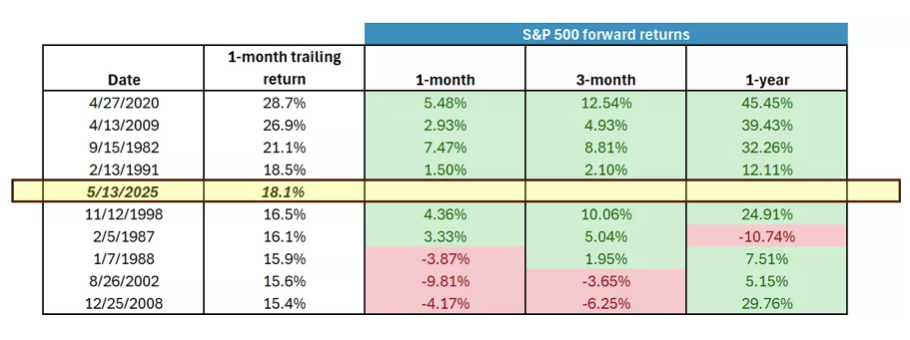
Overall, we still believe that peak uncertainty is behind us as the negotiating process kicks into high gear. Also, history offers some encouraging perspective. Strong rallies like those seen since the April 8 lows are often followed by continued positive returns. The trailing one-month monthly gain ranks as the fifth strongest in the past 40 years. While follow-through over the next month can be mixed, historical trends suggest that 12-month returns following rallies of this magnitude have been solid.
We recommend that investors dollar-cost average to take advantage of market swings, focus on diversification, and properly ladder fixed-income holdings to benefit from the potential for lower yields in 2026.
-
Final Words: Market indicates greed again. No new buys. Hold.
Below is last week sector performance report.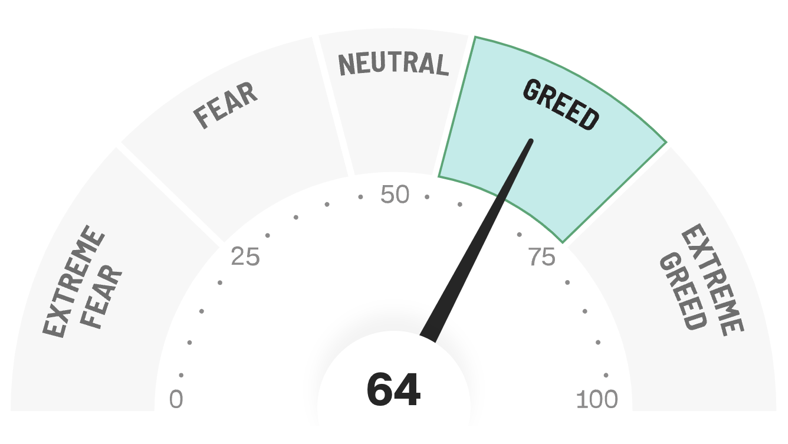
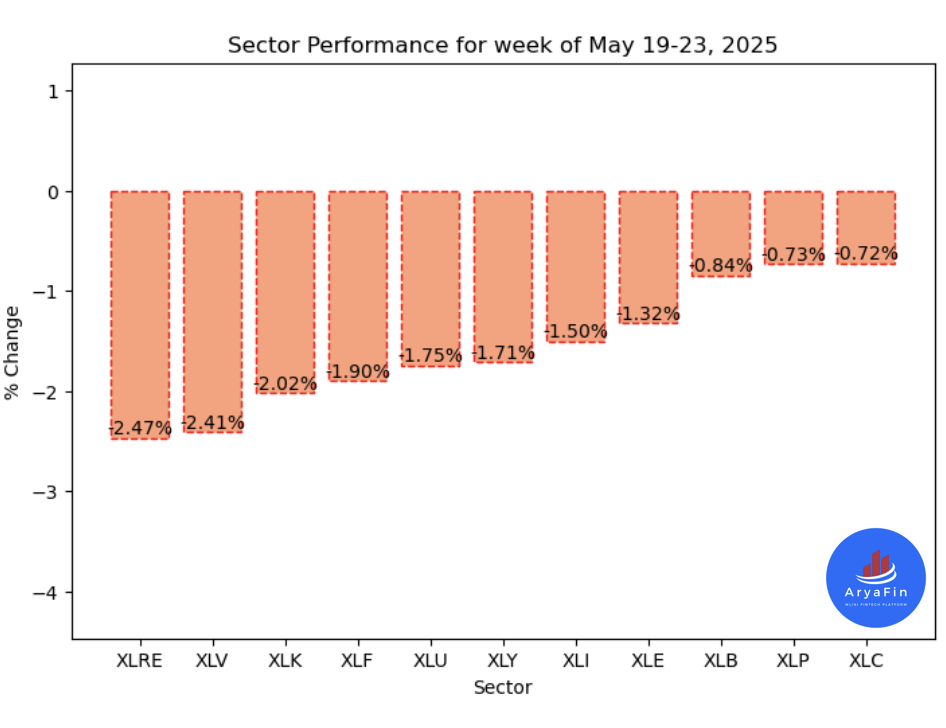
Top 11 Sector Performance for week of May 19-23, 2025
$XLRE The Real Estate Select Sector SPDR Fund -2.47%
$XLV Health Care Select Sector SPDR Fund -2.41%
$XLK Technology Select Sector SPDR Fund -2.02%
$XLF Financial Select Sector SPDR Fund -1.90%
$XLU Utilities Select Sector SPDR Fund -1.75%
$XLY Consumer Discretionary Select Sector SPDR Fund -1.71%
$XLI Industrial Select Sector SPDR Fund -1.50%
$XLE Energy Select Sector SPDR Fund -1.32%
$XLB Materials Select Sector SPDR Fund -0.84%
$XLP Consumer Staples Select Sector SPDR Fund -0.73%
$XLC Communication Services Select Sector SPDR Fund -0.72%
If you are looking for investment opportunities, you can take a look at our
Hidden Gems
section, and if you want to see our past performance, visit our
Past Performance section. If you are looking for
safe and low cost Exchange Traded funds(ETFs), check out our
ETF recommendations.
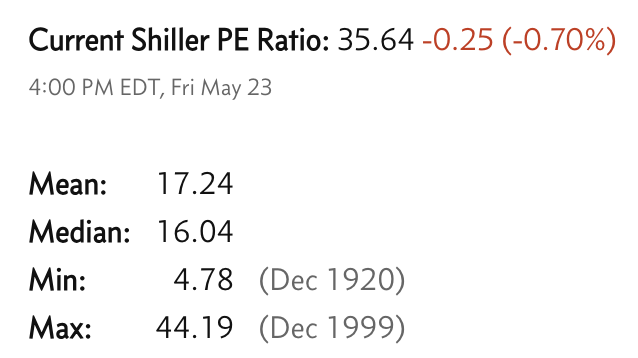
Currrent Shiller PE (see below) is showing overbought conditions as index is far above mean/media
and our AryaFin engine is indicating caution. Have a good weekend.